Wages
Electrician Pay in Canada in 2026: Wages in Every Province
Updated October 31, 2026
In Canada, the median wage for Electricians (except industrial and power system) (NOC 72200) is $35.00 an hour (Job Bank, data from 2023 to 2024, published November 19, 2025). Pay depends on the province and the region. The tables below give the low, median and high wage for each province, territory and region with a Job Bank figure.
What do electricians earn in Canada?
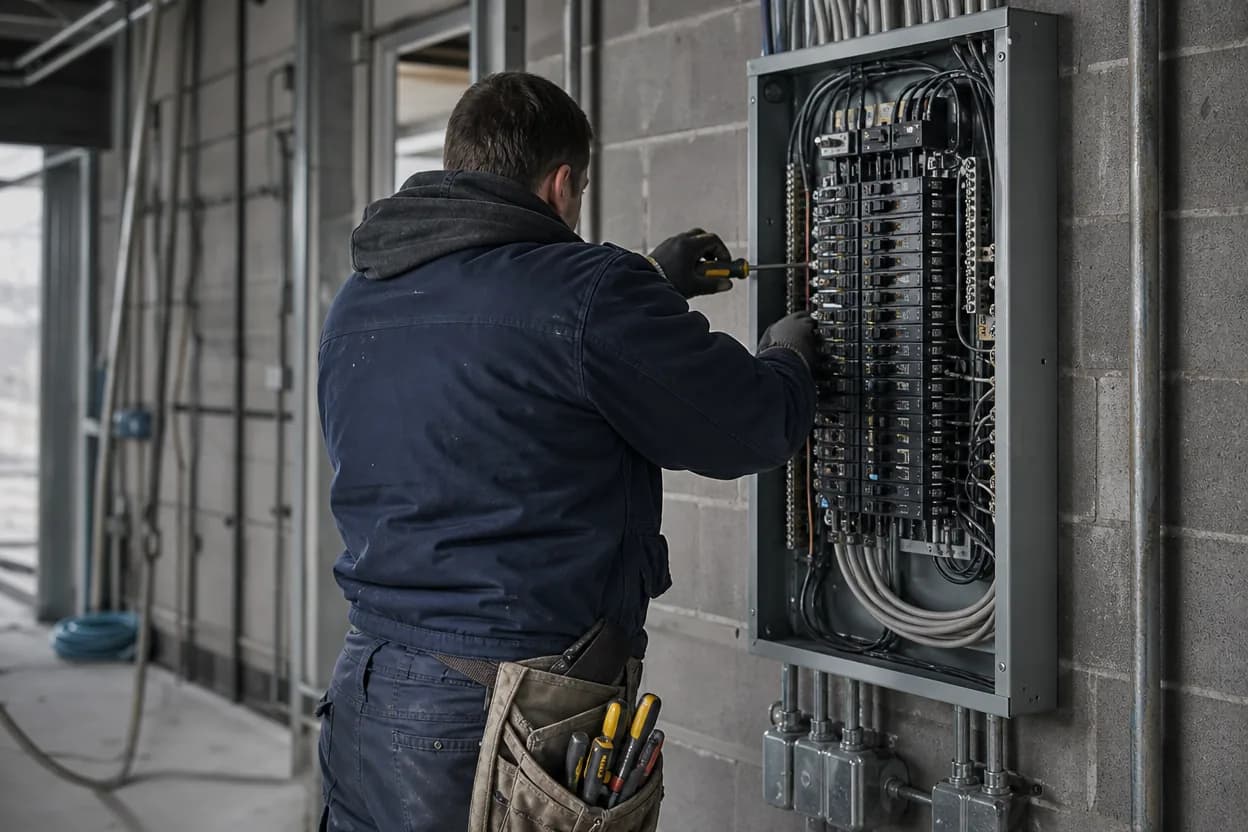
The first table gives Job Bank's wages for construction electricians across Canada. Half of the workers in a group earn more than the median, and half earn less. The province, region and industrial tables follow.
Sources1
Construction electrician wages across Canada
Construction electrician wages in every province and territory
Electricians (except industrial and power system) (NOC 72200) · Hourly · Dated November 19, 2025
| Place | Low | Median | High |
|---|---|---|---|
| Newfoundland and LabradorData from 2023 to 2024 | $18.70[1] | $31.00[1] | $45.40[1] |
| Prince Edward IslandData from 2023 to 2024 | $19.84[1] | $26.44[1] | $40.00[1] |
| Nova ScotiaData from 2023 to 2024 | $19.00[1] | $31.00[1] | $42.00[1] |
| New BrunswickData from 2023 to 2024 | $18.00[1] | $28.00[1] | $35.00[1] |
| QuebecData from 2023 to 2024 | $22.40[1] | $41.30[1] | $44.79[1] |
| OntarioData from 2023 to 2024 | $20.00[1] | $34.00[1] | $50.50[1] |
| ManitobaData from 2023 to 2024 | $17.15[1] | $35.00[1] | $46.00[1] |
| SaskatchewanData from 2023 to 2024 | $19.00[1] | $37.50[1] | $48.00[1] |
| AlbertaData from 2023 to 2024 | $21.50[1] | $38.00[1] | $46.00[1] |
| British ColumbiaData from 2023 to 2024 | $20.00[1] | $34.00[1] | $47.49[1] |
| Yukon | No published figure | No published figure | No published figure |
| Northwest TerritoriesData from 2024 | $30.14[1] | $40.55[1] | $50.56[1] |
| NunavutData from 2024 | $21.45[1] | $34.67[1] | $47.70[1] |
Which provinces pay electricians the most?
In the province and territory table, Quebec has the highest median, and Prince Edward Island has the lowest. The table also gives the high wage for each province and territory with a figure, beside the median.
Sources1
Pay in cities and regions
The table below lists every region with a Job Bank figure. It groups the regions by province, in the same order as the province table, and lists them by name. Find the region where the job is before you compare an offer.
Construction electrician wages by region
Electricians (except industrial and power system) (NOC 72200) · Hourly · Dated November 19, 2025
| Place | Low | Median | High |
|---|---|---|---|
| Avalon Peninsula, Newfoundland and LabradorData from 2023 to 2024 | $18.00[1] | $32.00[1] | $45.40[1] |
| Notre Dame–Central Bonavista Bay, Newfoundland and LabradorData from 2023 to 2024 | $18.70[1] | $31.00[1] | $45.40[1] |
| South Coast–Burin Peninsula, Newfoundland and LabradorData from 2023 to 2024 | $20.00[1] | $30.00[1] | $50.00[1] |
| West Coast–Northern Peninsula–Labrador, Newfoundland and LabradorData from 2023 to 2024 | $21.50[1] | $30.00[1] | $50.00[1] |
| Annapolis Valley, Nova ScotiaData from 2024 | $21.78[1] | $31.80[1] | $43.22[1] |
| Cape Breton, Nova ScotiaData from 2023 to 2024 | $19.00[1] | $31.00[1] | $42.00[1] |
| Halifax, Nova ScotiaData from 2023 to 2024 | $19.00[1] | $31.00[1] | $42.00[1] |
| North Shore, Nova ScotiaData from 2024 | $21.69[1] | $30.35[1] | $41.99[1] |
| Southern, Nova ScotiaData from 2024 | $20.07[1] | $28.38[1] | $36.17[1] |
| Campbellton–Miramichi, New BrunswickData from 2023 to 2024 | $19.00[1] | $29.00[1] | $34.50[1] |
| Edmundston–Woodstock, New BrunswickData from 2024 | $20.21[1] | $29.27[1] | $40.44[1] |
| Fredericton–Oromocto, New BrunswickData from 2024 | $20.49[1] | $29.54[1] | $40.15[1] |
| Moncton–Richibucto, New BrunswickData from 2023 to 2024 | $17.00[1] | $26.00[1] | $35.00[1] |
| Saint John–St. Stephen, New BrunswickData from 2023 to 2024 | $18.00[1] | $30.00[1] | $34.00[1] |
| Abitibi-Témiscamingue, QuebecData from 2023 to 2024 | $25.81[1] | $43.00[1] | $44.86[1] |
| Bas-Saint-Laurent, QuebecData from 2023 to 2024 | $22.00[1] | $42.00[1] | $44.79[1] |
| Capitale-Nationale, QuebecData from 2023 to 2024 | $21.95[1] | $40.83[1] | $44.79[1] |
| Centre-du-Québec, QuebecData from 2023 to 2024 | $21.95[1] | $40.31[1] | $44.79[1] |
| Chaudière-Appalaches, QuebecData from 2023 to 2024 | $21.95[1] | $40.72[1] | $44.79[1] |
| Côte-Nord, QuebecData from 2023 to 2024 | $22.40[1] | $40.00[1] | $47.03[1] |
| Estrie, QuebecData from 2023 to 2024 | $21.95[1] | $41.00[1] | $44.79[1] |
| Gaspésie–Îles-de-la-Madeleine, QuebecData from 2023 to 2024 | $21.95[1] | $43.00[1] | $45.98[1] |
| Lanaudière, QuebecData from 2023 to 2024 | $22.40[1] | $42.15[1] | $44.79[1] |
| Laurentides, QuebecData from 2023 to 2024 | $22.40[1] | $42.21[1] | $44.79[1] |
| Laval, QuebecData from 2023 to 2024 | $22.40[1] | $43.00[1] | $44.86[1] |
| Mauricie, QuebecData from 2023 to 2024 | $21.95[1] | $38.13[1] | $45.00[1] |
| Montérégie, QuebecData from 2023 to 2024 | $22.40[1] | $43.00[1] | $44.79[1] |
| Montréal, QuebecData from 2023 to 2024 | $22.40[1] | $37.31[1] | $44.79[1] |
| Outaouais, QuebecData from 2023 to 2024 | $21.95[1] | $39.00[1] | $47.91[1] |
| Saguenay–Lac-Saint-Jean, QuebecData from 2023 to 2024 | $23.54[1] | $42.59[1] | $46.12[1] |
| Hamilton–Niagara Peninsula, OntarioData from 2023 to 2024 | $20.00[1] | $32.00[1] | $50.00[1] |
| Kitchener–Waterloo–Barrie, OntarioData from 2023 to 2024 | $20.00[1] | $36.00[1] | $52.00[1] |
| London, OntarioData from 2023 to 2024 | $18.50[1] | $29.75[1] | $49.37[1] |
| Muskoka–Kawarthas, OntarioData from 2023 to 2024 | $22.00[1] | $34.80[1] | $46.75[1] |
| Northeast, OntarioData from 2023 to 2024 | $19.00[1] | $31.00[1] | $52.00[1] |
| Northwest, OntarioData from 2024 | $23.10[1] | $36.82[1] | $55.21[1] |
| Ottawa, OntarioData from 2024 | $24.22[1] | $38.45[1] | $50.22[1] |
| Stratford–Bruce Peninsula, OntarioData from 2023 to 2024 | $20.00[1] | $32.50[1] | $44.50[1] |
| Toronto, OntarioData from 2024 | $20.62[1] | $34.86[1] | $51.40[1] |
| Windsor–Sarnia, OntarioData from 2023 to 2024 | $20.00[1] | $35.00[1] | $54.70[1] |
| Interlake, ManitobaData from 2023 to 2024 | $16.85[1] | $39.80[1] | $45.00[1] |
| North Central, ManitobaData from 2023 to 2024 | $17.15[1] | $35.00[1] | $46.00[1] |
| Parklands, ManitobaData from 2024 | $24.53[1] | $36.75[1] | $47.87[1] |
| South Central, ManitobaData from 2024 | $22.80[1] | $36.54[1] | $45.54[1] |
| Southeast, ManitobaData from 2024 | $22.07[1] | $35.14[1] | $45.36[1] |
| Southwest, ManitobaData from 2023 to 2024 | $19.50[1] | $36.00[1] | $47.00[1] |
| Winnipeg, ManitobaData from 2023 to 2024 | $17.50[1] | $35.00[1] | $46.00[1] |
| Northern, SaskatchewanData from 2023 to 2024 | $24.20[1] | $35.00[1] | $40.00[1] |
| Prince Albert, SaskatchewanData from 2023 to 2024 | $24.20[1] | $35.00[1] | $40.00[1] |
| Regina–Moose Mountain, SaskatchewanData from 2023 to 2024 | $21.00[1] | $37.00[1] | $44.50[1] |
| Saskatoon–Biggar, SaskatchewanData from 2023 to 2024 | $19.00[1] | $37.50[1] | $48.00[1] |
| Swift Current–Moose Jaw, SaskatchewanData from 2023 to 2024 | $18.00[1] | $40.00[1] | $50.00[1] |
| Banff–Jasper–Rocky Mountain House, AlbertaData from 2024 | $23.66[1] | $35.03[1] | $50.68[1] |
| Calgary, AlbertaData from 2023 to 2024 | $24.00[1] | $40.00[1] | $46.00[1] |
| Camrose–Drumheller, AlbertaData from 2024 | $24.28[1] | $36.30[1] | $47.72[1] |
| Edmonton, AlbertaData from 2023 to 2024 | $21.50[1] | $38.00[1] | $45.00[1] |
| Lethbridge–Medicine Hat, AlbertaData from 2023 to 2024 | $18.00[1] | $34.20[1] | $43.00[1] |
| Red Deer, AlbertaData from 2024 | $23.80[1] | $36.09[1] | $46.56[1] |
| Wood Buffalo–Cold Lake, AlbertaData from 2024 | $26.63[1] | $40.93[1] | $59.63[1] |
| Cariboo, British ColumbiaData from 2024 | $24.76[1] | $37.25[1] | $53.25[1] |
| Kootenay, British ColumbiaData from 2024 | $23.87[1] | $33.39[1] | $45.30[1] |
| Lower Mainland, British ColumbiaData from 2024 | $21.82[1] | $34.57[1] | $47.69[1] |
| North Coast, British ColumbiaData from 2024 | $26.57[1] | $37.93[1] | $54.53[1] |
| Northeast, British ColumbiaData from 2024 | $27.12[1] | $38.12[1] | $54.23[1] |
| Thompson–Okanagan, British ColumbiaData from 2024 | $22.69[1] | $34.94[1] | $46.13[1] |
| Vancouver Island and Coast, British ColumbiaData from 2024 | $21.60[1] | $33.28[1] | $44.42[1] |
Do industrial electricians earn more?
The two industrial tables below give the national and provincial figures. Compare them with the construction tables above. Saskatchewan has the highest industrial median, and Prince Edward Island has the lowest.
Sources1
Industrial electrician wages across Canada
Industrial electrician wages in every province and territory
Industrial electricians (NOC 72201) · Hourly · Data from 2023 to 2024 · Dated November 19, 2025
| Place | Low | Median | High |
|---|---|---|---|
| Newfoundland and Labrador | $26.00[1] | $43.26[1] | $58.10[1] |
| Prince Edward Island | $29.00[1] | $34.93[1] | $42.50[1] |
| Nova Scotia | $30.00[1] | $40.00[1] | $50.00[1] |
| New Brunswick | $28.75[1] | $42.00[1] | $59.62[1] |
| Quebec | $24.80[1] | $43.00[1] | $48.00[1] |
| Ontario | $29.00[1] | $40.50[1] | $48.00[1] |
| Manitoba | $27.00[1] | $40.50[1] | $48.00[1] |
| Saskatchewan | $38.00[1] | $49.00[1] | $57.78[1] |
| Alberta | $25.00[1] | $44.00[1] | $68.00[1] |
| British Columbia | $35.90[1] | $45.00[1] | $54.95[1] |
| Yukon | No published figure | No published figure | No published figure |
| Northwest Territories | No published figure | No published figure | No published figure |
| Nunavut | No published figure | No published figure | No published figure |
How much do apprentice electricians earn?

Some provinces set apprentice pay as a share of the journeyperson wage. The share depends on your level or hours. The list below gives the schedules for Nova Scotia, Manitoba and Saskatchewan. In Manitoba, in-class training costs you $580 per level.
Apprentice wage schedules by province
- Nova Scotia sets 45%, 50%, 55%, 60%, 65%, 70%, 75% and 80% of the journeyperson wage, rising every 900 hours over 7,200 hours.[3]
- Manitoba's trade sheet lists 40%, 50%, 65% and 80% of the journeyperson wage rate for levels 1 to 4.[2]
- Saskatchewan's 2020 table, an unofficial consolidation, lists 40%, 45%, 50%, 55%, 60%, 65%, 70% and 70% of a new journeyperson's hourly rate, one share for each 900 hours over 7,200 hours.[4]
Fair-wage and minimum rates compared with the median
Some public contracts, and one provincial law, set a rate for each trade. The list below gives three of them for journeyperson electricians. They are the City of Toronto fair wage schedule for industrial, commercial and institutional (ICI) work, Manitoba's ICI minimum wage schedule and Burnaby's fair wage schedule. Burnaby's schedule follows the standard union agreement rates in British Columbia. To compare a rate with the Job Bank median, find the Toronto, Winnipeg or Lower Mainland row in the region table. Keep two points in mind. The schedule rates are journeyperson rates, and the Job Bank median covers everyone in the occupation group. The schedule rates are for 2026 and 2027, and the medians are for 2023 to 2024 or for 2024.
Published fair-wage and minimum rates for journeyperson electricians
- The City of Toronto fair wage schedule for ICI work lists $56.50 an hour plus $16.50 in fringe benefits for a journeyperson electrical worker from May 1, 2026.[5]
- From May 1, 2027, the Toronto ICI rate rises to $59.15 an hour plus $16.57 in fringe benefits.[5]
- On City of Toronto ICI contracts, hours past the weekly limit, 37.5 hours for electrical workers, are paid at time and a half.[5]
- Manitoba's ICI construction minimum wage schedule lists $44.61 an hour for a journeyperson construction electrician from May 1, 2026 to April 30, 2027, and $45.50 from May 1, 2027.[7]
- Burnaby's fair wage schedule lists $51.46 an hour plus $15.79 in remuneration, a total of $67.25, for a journeyman electrician. It follows the CLRA summary of standard union agreement rates for June 2026.[6]
Before you move for electrical work

Check these points before you accept a job in another city or province.
- Compare the regional median, not only the provincial one. The region table lists each region under its province.
- Ask whether the job is on a public contract with a fair wage rate, such as a City of Toronto ICI contract. The fair-wage list above gives the rates.
- Ask how overtime is paid. The fair-wage list above gives the overtime rule for City of Toronto ICI contracts.
- Check the certification rules. In Manitoba, you must be a certified journeyperson or a registered apprentice to work as a construction electrician.
- Ask whether a quoted rate is base pay or a total package. Burnaby's schedule, for example, adds remuneration on top of the wage.
- If you are an apprentice, check the wage schedule in the new province. The apprentice list above gives three schedules.
How to read these figures
Job Bank gives a low, a median and a high hourly wage for each place. The note under each table shows the period that the figures cover. Most rows cover 2023 to 2024, and some rows cover 2024 only. The high wage is not a maximum. A cell that says No published figure has no Job Bank figure in this release.
Questions and answers
How much does an electrician make in Ontario?
Ontario's low, median and high wages are in the province and territory table. For Toronto, Ottawa or another Ontario city, find its region under Ontario in the region table.
How much does an electrician make in Alberta?
Alberta's wages are in the province and territory table. Calgary, Edmonton and Wood Buffalo–Cold Lake each have a row under Alberta in the region table.
How much does an electrician make in British Columbia?
British Columbia's wages are in the province and territory table. For Vancouver, use the Lower Mainland row in the region table. Industrial electrician wages for British Columbia are in the industrial table.
How do I estimate my pay as an apprentice?
Find your province in the apprentice wage schedules. Multiply the share for your level or hours by the journeyperson wage where you work.
Do union electricians earn more?
No source on this page compares union and non-union pay directly. Burnaby's fair wage schedule follows standard union agreement rates in British Columbia. Compare its rate in the fair-wage list with the Lower Mainland row in the region table.
How is electrician overtime paid?
For City of Toronto ICI contracts, the fair-wage list gives the overtime rule. For other jobs, ask the employer how it pays overtime before you accept.
Sources
- Job Bank open wage data (Wages dataset), 2025-11-19
Employment and Social Development Canada. Retrieved October 31, 2026
- Construction Electrician: Manitoba Compulsory Certification Trade (trade sheet)
Apprenticeship Manitoba, Government of Manitoba. Retrieved October 30, 2026
- Construction Electrician Trade Regulations, N.S. Reg. 188/2016
Province of Nova Scotia, Office of the Registrar of Regulations. Retrieved October 30, 2026
- SATCC wage rates table for apprentices (2020)
Saskatchewan Apprenticeship and Trade Certification Commission (SATCC). Retrieved October 30, 2026
- Fair Wage Schedule 2025-2028, Industrial, Commercial and Institutional (I.C.I.) Work
City of Toronto, Fair Wage Office. Retrieved October 30, 2026
- Schedule A to the Fair Wage Schedule, Compensation Schedule (revised 2026 Aug 14)
City of Burnaby. Retrieved October 30, 2026
- Manitoba ICI Construction Sector Minimum Wage Schedules
Government of Manitoba, Employment Standards. Retrieved October 30, 2026