Wages
Sheet Metal Worker Pay in the US (2026)
Updated November 11, 2026
In the United States, the median wage for Sheet Metal Workers (SOC 47-2211) is $29.71 an hour (BLS, data from May 2025). Pay depends on the state and the metro area. The tables below give hourly and yearly wages for each state with a BLS figure, and hourly wages for large metro areas.
What do sheet metal workers earn in the US?
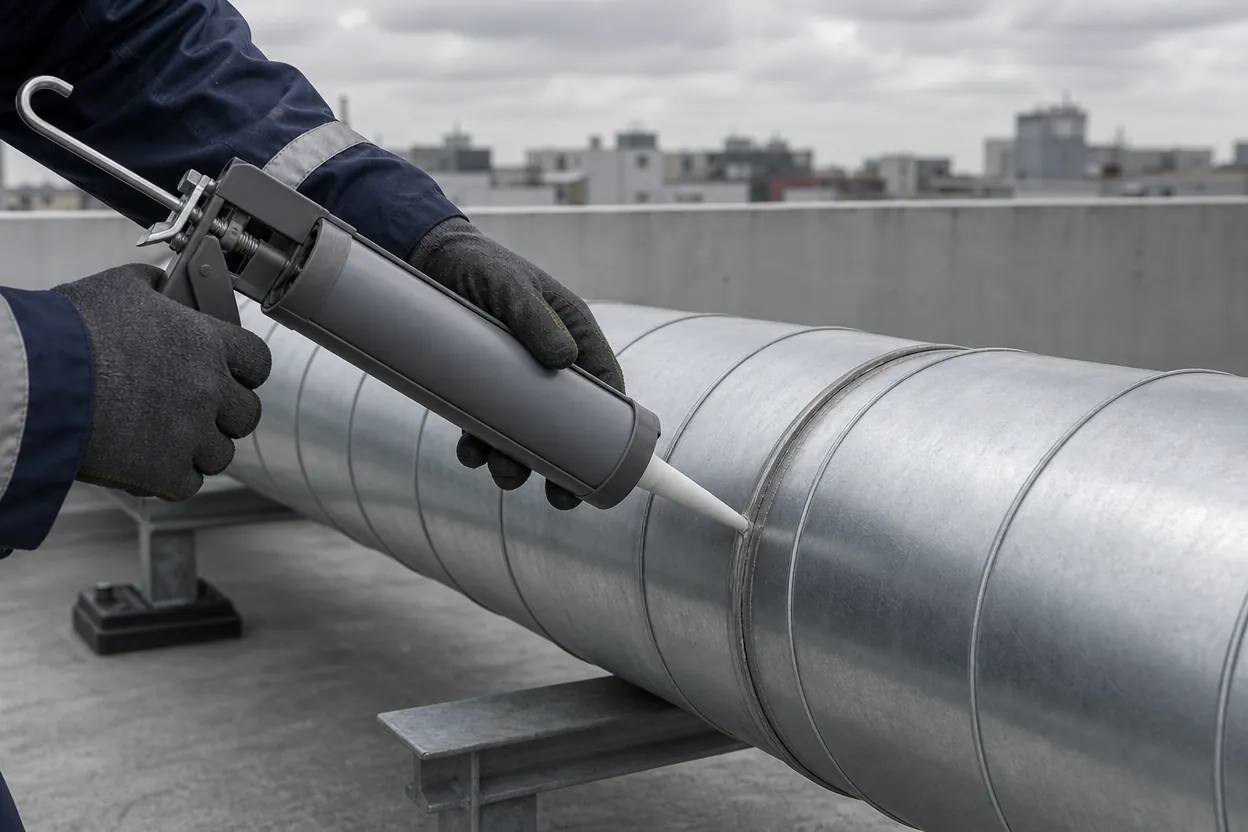
The first two tables give the Bureau of Labor Statistics (BLS) wages for sheet metal workers across the United States. Half of these workers earn more than the median, and half earn less. The occupation covers workers who fabricate, install and repair sheet metal products such as ducts, and it includes duct installers and apprentices. BLS counts helpers in separate helper occupations, so these figures do not include them.
Sheet metal worker wages across the United States
Yearly sheet metal worker pay across the United States
Which states pay sheet metal workers the most?
In the state table, Washington has the highest median, and Arkansas has the lowest.
Sources1
Sheet metal worker wages by state
Sheet Metal Workers (SOC 47-2211) · Hourly, US dollars · Data from May 2025
| Place | 10th percentile | Median | 90th percentile |
|---|---|---|---|
| Alabama | $17.07[1] | $22.85[1] | $34.26[1] |
| Alaska | $23.70[1] | $45.48[1] | $56.05[1] |
| Arizona | $17.48[1] | $24.16[1] | $38.82[1] |
| Arkansas | $17.21[1] | $22.03[1] | $27.59[1] |
| California | $22.79[1] | $36.82[1] | $63.55[1] |
| Colorado | $21.05[1] | $27.83[1] | $40.17[1] |
| Connecticut | $23.93[1] | $37.86[1] | $45.16[1] |
| Delaware | $17.93[1] | $29.55[1] | $41.24[1] |
| District of Columbia | No published figure | No published figure | No published figure |
| Florida | $17.37[1] | $23.87[1] | $34.49[1] |
| Georgia | $18.67[1] | $27.31[1] | $36.97[1] |
| Hawaii | $25.35[1] | $46.32[1] | $57.19[1] |
| Idaho | $17.47[1] | $22.29[1] | $37.72[1] |
| Illinois | $20.30[1] | $41.65[1] | $56.69[1] |
| Indiana | $20.49[1] | $30.79[1] | $50.04[1] |
| Iowa | $21.04[1] | $31.95[1] | $43.97[1] |
| Kansas | $18.60[1] | $30.13[1] | $52.18[1] |
| Kentucky | $19.51[1] | $29.17[1] | $41.01[1] |
| Louisiana | $16.66[1] | $24.19[1] | $37.40[1] |
| Maine | $23.05[1] | $29.87[1] | $36.29[1] |
| Maryland | $22.50[1] | $30.08[1] | $40.70[1] |
| Massachusetts | $22.33[1] | $39.47[1] | $58.20[1] |
| Michigan | $19.68[1] | $31.01[1] | $46.34[1] |
| Minnesota | $22.85[1] | $35.08[1] | $56.24[1] |
| Mississippi | $17.58[1] | $23.80[1] | $33.96[1] |
| Missouri | $18.31[1] | $30.56[1] | $53.16[1] |
| Montana | $21.30[1] | $29.53[1] | $40.49[1] |
| Nebraska | $15.45[1] | $30.98[1] | $45.67[1] |
| Nevada | $18.33[1] | $22.47[1] | $58.53[1] |
| New Hampshire | $16.43[1] | $28.75[1] | $38.43[1] |
| New Jersey | $22.25[1] | $44.64[1] | $62.80[1] |
| New Mexico | $17.50[1] | $27.27[1] | $40.71[1] |
| New York | $19.39[1] | $35.46[1] | $60.62[1] |
| North Carolina | $17.93[1] | $24.39[1] | $37.51[1] |
| North Dakota | $23.11[1] | $31.34[1] | $40.74[1] |
| Ohio | $20.77[1] | $35.96[1] | $45.31[1] |
| Oklahoma | $22.11[1] | $31.56[1] | $38.02[1] |
| Oregon | $23.15[1] | $35.46[1] | $57.98[1] |
| Pennsylvania | $21.95[1] | $29.52[1] | $60.78[1] |
| Rhode Island | $20.51[1] | $31.30[1] | $39.42[1] |
| South Carolina | $17.83[1] | $24.00[1] | $36.68[1] |
| South Dakota | $18.47[1] | $22.98[1] | $41.72[1] |
| Tennessee | $18.61[1] | $28.45[1] | $38.15[1] |
| Texas | $17.79[1] | $26.08[1] | $37.69[1] |
| Utah | $21.33[1] | $30.36[1] | $41.24[1] |
| Vermont | $20.64[1] | $28.00[1] | $39.87[1] |
| Virginia | $18.00[1] | $25.10[1] | $35.40[1] |
| Washington | $27.72[1] | $47.38[1] | $71.76[1] |
| West Virginia | $18.35[1] | $34.81[1] | $36.55[1] |
| Wisconsin | $21.71[1] | $37.38[1] | $51.47[1] |
| Wyoming | $20.36[1] | $28.24[1] | $34.81[1] |
Yearly sheet metal worker pay by state
Sheet Metal Workers (SOC 47-2211) · Yearly, US dollars · Data from May 2025
| Place | Median | 90th percentile |
|---|---|---|
| Alabama | $47,530[1] | $71,270[1] |
| Alaska | $94,600[1] | $116,580[1] |
| Arizona | $50,260[1] | $80,750[1] |
| Arkansas | $45,820[1] | $57,380[1] |
| California | $76,590[1] | $132,190[1] |
| Colorado | $57,880[1] | $83,550[1] |
| Connecticut | $78,750[1] | $93,940[1] |
| Delaware | $61,460[1] | $85,790[1] |
| District of Columbia | No published figure | No published figure |
| Florida | $49,640[1] | $71,740[1] |
| Georgia | $56,800[1] | $76,900[1] |
| Hawaii | $96,350[1] | $118,960[1] |
| Idaho | $46,350[1] | $78,470[1] |
| Illinois | $86,630[1] | $117,910[1] |
| Indiana | $64,040[1] | $104,080[1] |
| Iowa | $66,460[1] | $91,450[1] |
| Kansas | $62,670[1] | $108,530[1] |
| Kentucky | $60,680[1] | $85,310[1] |
| Louisiana | $50,320[1] | $77,790[1] |
| Maine | $62,120[1] | $75,490[1] |
| Maryland | $62,560[1] | $84,650[1] |
| Massachusetts | $82,100[1] | $121,050[1] |
| Michigan | $64,490[1] | $96,390[1] |
| Minnesota | $72,970[1] | $116,990[1] |
| Mississippi | $49,500[1] | $70,630[1] |
| Missouri | $63,560[1] | $110,580[1] |
| Montana | $61,420[1] | $84,220[1] |
| Nebraska | $64,440[1] | $94,980[1] |
| Nevada | $46,730[1] | $121,730[1] |
| New Hampshire | $59,800[1] | $79,930[1] |
| New Jersey | $92,840[1] | $130,630[1] |
| New Mexico | $56,720[1] | $84,690[1] |
| New York | $73,760[1] | $126,090[1] |
| North Carolina | $50,730[1] | $78,020[1] |
| North Dakota | $65,180[1] | $84,740[1] |
| Ohio | $74,790[1] | $94,240[1] |
| Oklahoma | $65,640[1] | $79,090[1] |
| Oregon | $73,750[1] | $120,600[1] |
| Pennsylvania | $61,400[1] | $126,430[1] |
| Rhode Island | $65,100[1] | $81,980[1] |
| South Carolina | $49,920[1] | $76,300[1] |
| South Dakota | $47,800[1] | $86,780[1] |
| Tennessee | $59,170[1] | $79,360[1] |
| Texas | $54,240[1] | $78,400[1] |
| Utah | $63,140[1] | $85,770[1] |
| Vermont | $58,250[1] | $82,940[1] |
| Virginia | $52,220[1] | $73,640[1] |
| Washington | $98,550[1] | $149,260[1] |
| West Virginia | $72,390[1] | $76,020[1] |
| Wisconsin | $77,760[1] | $107,060[1] |
| Wyoming | $58,740[1] | $72,400[1] |
Which metro areas pay sheet metal workers the most?
The metro table covers the 50 metro areas with the most jobs in all occupations. Of these, it lists the 20 with the most sheet metal workers, by name. Among them, Seattle-Tacoma-Bellevue, WA has the highest median, and Phoenix-Mesa-Chandler, AZ has the lowest. If your metro area is not in the table, use your state's row in the state table.
Sources1
Sheet metal worker wages in the 20 of the 50 largest metro areas with the most sheet metal workers
Sheet Metal Workers (SOC 47-2211) · Hourly, US dollars · Data from May 2025
| Place | 10th percentile | Median | 90th percentile |
|---|---|---|---|
| Atlanta-Sandy Springs-Roswell, GA | $19.62[1] | $27.28[1] | $38.43[1] |
| Austin-Round Rock-San Marcos, TX | $18.28[1] | $30.29[1] | $37.43[1] |
| Boston-Cambridge-Newton, MA-NH | $20.77[1] | $39.69[1] | $58.20[1] |
| Chicago-Naperville-Elgin, IL-IN | $20.30[1] | $45.82[1] | $58.81[1] |
| Dallas-Fort Worth-Arlington, TX | $18.11[1] | $27.04[1] | $37.72[1] |
| Detroit-Warren-Dearborn, MI | $21.92[1] | $36.12[1] | $47.34[1] |
| Houston-Pasadena-The Woodlands, TX | $17.71[1] | $24.94[1] | $39.86[1] |
| Indianapolis-Carmel-Greenwood, IN | $22.29[1] | $31.66[1] | $47.12[1] |
| Los Angeles-Long Beach-Anaheim, CA | $22.70[1] | $34.96[1] | $62.12[1] |
| Miami-Fort Lauderdale-West Palm Beach, FL | $17.61[1] | $24.86[1] | $36.98[1] |
| Minneapolis-St. Paul-Bloomington, MN-WI | $23.08[1] | $35.08[1] | $56.86[1] |
| New York-Newark-Jersey City, NY-NJ | $20.00[1] | $36.89[1] | $62.34[1] |
| Oklahoma City, OK | $23.22[1] | $32.76[1] | $37.36[1] |
| Philadelphia-Camden-Wilmington, PA-NJ-DE-MD | $21.88[1] | $37.09[1] | $60.51[1] |
| Phoenix-Mesa-Chandler, AZ | $17.52[1] | $24.63[1] | $39.23[1] |
| Portland-Vancouver-Hillsboro, OR-WA | $24.03[1] | $38.26[1] | $61.27[1] |
| San Diego-Chula Vista-Carlsbad, CA | $22.81[1] | $38.50[1] | $60.84[1] |
| Seattle-Tacoma-Bellevue, WA | $29.49[1] | $52.80[1] | $71.76[1] |
| Virginia Beach-Chesapeake-Norfolk, VA-NC | $18.31[1] | $30.48[1] | $35.43[1] |
| Washington-Arlington-Alexandria, DC-VA-MD-WV | $21.05[1] | $29.46[1] | $41.24[1] |
How much do apprentice sheet metal workers earn?
New York City's public-works schedule sets a rate for each apprentice step. The list below gives its sheet metal apprentice rates, from the first month to the fifth year. Only apprentices registered in a New York State Department of Labor program that their employer takes part in can be paid these rates. Other apprentices get the journeyperson rate for the work they do.
Sources2
New York City sheet metal apprentice rates, July 1, 2026 to June 30, 2027
- Sheet metal apprentice in New York City, months 0 to 6: $19.57 an hour plus $8.26 in supplemental benefits, July 1, 2026 to June 30, 2027.[2]
- Sheet metal apprentice in New York City, months 7 to 18: $19.84 an hour plus $22.30 in supplemental benefits.[2]
- Sheet metal apprentice in New York City, months 19 to 30: $25.57 an hour plus $30.13 in supplemental benefits.[2]
- Sheet metal apprentice in New York City, months 31 to 36 and months 37 to 42: $31.31 an hour plus $35.67 in supplemental benefits.[2]
- Sheet metal apprentice in New York City, months 43 to 48 and months 49 to 54: $39.93 an hour plus $44.01 in supplemental benefits.[2]
- Sheet metal apprentice in New York City, months 55 to 60: $45.64 an hour plus $49.58 in supplemental benefits.[2]
Prevailing wage rates compared with the median
On public works, state and city rules set a rate for each trade. The list below gives the rates for San Francisco, Cook County and New York City. To compare a rate with the BLS median, find the state in the state table. San Francisco's total counts wage and benefits together. Each public-works rate is for one classification, and the BLS median covers all sheet metal workers in the state. The public-works schedules are dated 2026, and the BLS medians are for May 2025.
Published prevailing wage rates for sheet metal workers
- San Francisco prevailing wage for a sheet metal worker: a basic hourly rate of $81.34 and a straight-time total hourly rate of $140.34, in a determination issued August 22, 2026 with an expiration date of June 27, 2027. Employer benefit payments can vary and lower the taxable basic rate, but the total hourly rate cannot be less than the prevailing rate.[3]
- Cook County, Illinois prevailing wage for a sheet metal worker on building work: $56.85 an hour base and $62.54 for a foreman, posted October 19, 2026.[4]
- New York City prevailing wage for a sheet metal worker: $57.08 an hour plus $60.70 in supplemental benefits, July 1, 2026 to June 30, 2027.[5]
How is overtime paid on public works?
In Cook County, sheet metal workers on building work get time and a half after 8 hours on a weekday and on Saturdays, and double time on Sundays and holidays. In New York City, they get time and a half after an 8-hour day and on Saturday. New York City pays double time after 10 hours on Saturday, on Sunday and on holidays. In New York City, a Saturday can be a make-up day at straight time when bad weather costs a day that week. For other jobs, ask the employer how it pays overtime before you accept.
Before you move for sheet metal work
Check these points before you take a job in another state.
- Compare the metro median in the metro table, not only the state figure.
- Ask whether the job is on a public-works or union contract. The prevailing-wage list above gives public-works rates for three places.
- Ask whether a quoted rate is base pay or a total package. New York City adds supplemental benefits on top of the wage.
- Ask how overtime is paid. The overtime section above gives two public-works rules.
- If you are an apprentice, ask which step you start in. The New York City list above gives a rate for each step.
How to read these figures
The 10th percentile is the wage that 10 percent of sheet metal workers earn less than. The 90th percentile is the wage that 10 percent earn more than. All BLS figures on this page are for May 2025.
Sources1
Questions and answers
How much does a sheet metal worker make a year?
The yearly table gives the national figures. The yearly state table gives them for each state with a figure.
How much does a sheet metal worker make in California?
California's figures are in the state table. Los Angeles-Long Beach-Anaheim, CA and San Diego-Chula Vista-Carlsbad, CA each have a row in the metro table. For San Francisco public works, the prevailing-wage list gives a San Francisco rate.
How much does a sheet metal worker make in Texas?
Texas is in the state table. Austin-Round Rock-San Marcos, TX, Dallas-Fort Worth-Arlington, TX and Houston-Pasadena-The Woodlands, TX each have a row in the metro table.
How much does a sheet metal worker make in New York?
New York is in the state table. New York-Newark-Jersey City, NY-NJ has a row in the metro table. The prevailing-wage list gives a New York City public-works rate for a sheet metal worker, and the apprentice list gives the city's sheet metal apprentice rates.
Can Werko match me with a US sheet metal worker job?
No. Werko matches trades workers in Canada now. You can join the US waitlist on this page.
Sources
- BLS Occupational Employment and Wage Statistics (OEWS), May 2025
U.S. Bureau of Labor Statistics. Retrieved October 31, 2026
- Construction Apprentice Prevailing Wage Schedule, July 1, 2026 to June 30, 2027
Office of the Comptroller, City of New York (Bureau of Labor Law). Retrieved October 31, 2026
- General Prevailing Wage Determination SFR-2026-2, San Francisco
California Department of Industrial Relations (Office of the Director - Research Unit). Retrieved October 31, 2026
- Cook County Prevailing Wage Rates posted on 10/19/2026
Illinois Department of Labor. Retrieved October 31, 2026
- Construction Worker Prevailing Wage Schedule, July 1, 2026 to June 30, 2027
Office of the Comptroller, City of New York (Bureau of Labor Law). Retrieved October 31, 2026
- 2018 Standard Occupational Classification System, major groups and definitions
U.S. Bureau of Labor Statistics. Retrieved November 11, 2026